




JP Morgan ranked first in the TAB Global 1000 World’s Strongest Banks 2026 ranking, followed by Saudi National Bank, OCBC, China Merchants Bank and Royal Bank of Canada. Bank of China (Hong Kong), First Abu Dhabi Bank, Bank of China, Canadian Imperial Bank of Commerce and Citigroup completed the top ten.
The institutions at the top span different markets, business models and balance-sheet sizes. Large banks are much more heavily represented among the strongest institutions, but the relationship is far from absolute. Some relatively small banks rank hundreds of places above their positions by assets, while some of the world’s larger institutions fall well below them.
Financial strength also does not increase simply by maximising an individual measure. Banks producing the fastest operating-profit growth are not necessarily the strongest overall, while progressively larger regulatory liquidity buffers do not correspond with progressively greater financial strength.
Geography matters as well. Middle Eastern banks have the highest representation among the strongest 250 institutions, ahead of Europe and Asia Pacific. That pattern persists even after the newly introduced sovereign-risk component is removed, indicating that differences in sovereign ratings alone do not explain the region’s position.
More revealing are the relationships between size and strength, the institutions that break those patterns, and the measures that do not improve continuously as overall financial strength increases.
How the TAB Global 1000 World’s Strongest Banks ranking works
The TAB Global 1000 World’s Strongest Banks ranking assesses the financial strength of the 1,000 institutions covered by the TAB Global 1000 using their latest full-year financial results. The 2026 assessment is based on financial year (FY2025) results, including institutions with financial years ending up to March 2026, provided their results were published by 31 August 2026.
The assessment covers institutions represented in the TAB Global 1000. Subsidiaries are generally excluded where their consolidated parent is already represented in the 1,000-bank universe. An exception can be made where a subsidiary is separately regulated and formally designated as a domestic systemically important bank (D-SIB) or equivalent systemically important institution, or has a distinct statutory or systemic role.
The 2026 scorecard assesses seven dimensions: sovereign risk, scale, balance-sheet growth, risk profile, profitability, asset quality and liquidity. Asset quality carries the largest weighting at 23.7%, followed by risk profile at 18.9%, profitability and liquidity at 16.6% each, scale at 14.2%, and sovereign risk and balance-sheet growth at 5% each.
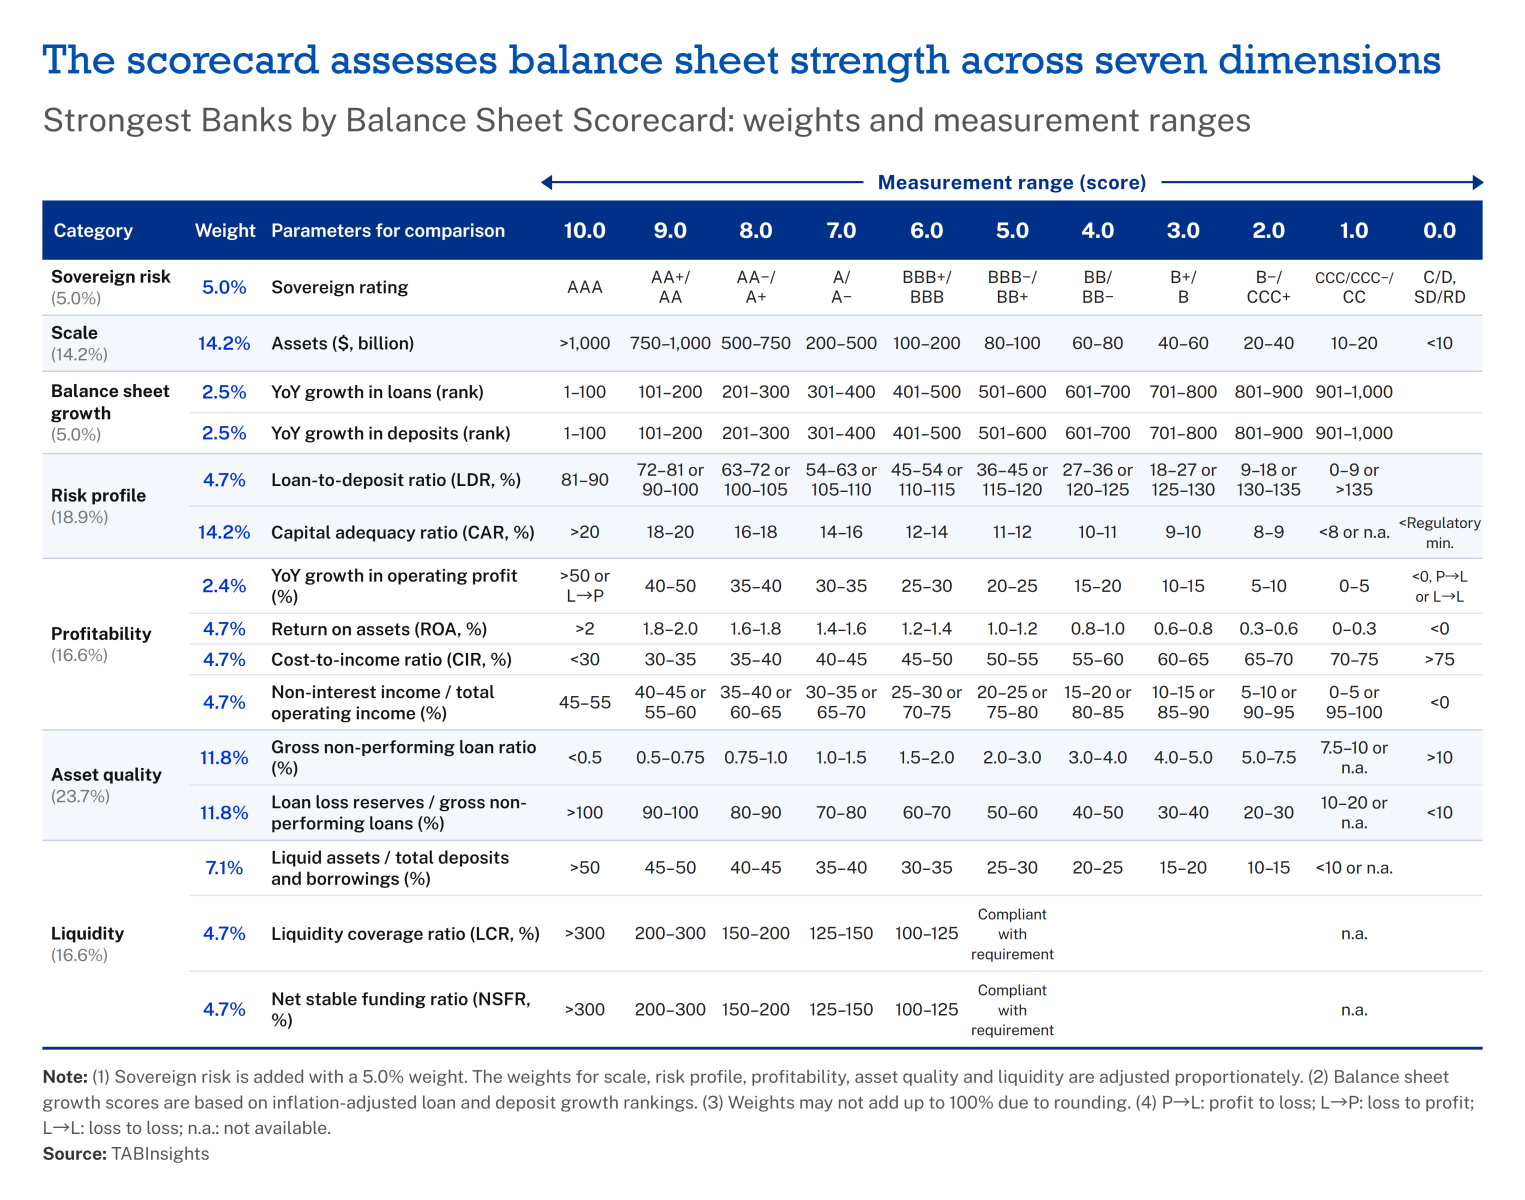
A major methodological change in 2026 is the introduction of sovereign risk as a seventh dimension with a 5% weighting. TAB Global converts sovereign ratings from S&P Global Ratings, Moody’s Ratings and Fitch Ratings onto a common scale. The addition of sovereign risk required the weightings of five existing dimensions—scale, risk profile, profitability, asset quality and liquidity—to be adjusted proportionately, while balance-sheet growth retained its 5% weighting.
Balance-sheet growth is assessed in real rather than nominal terms, with reported loan and deposit growth adjusted for consumer-price inflation in each market. This reduces the effect of inflation on comparisons between banks operating in markets with different inflation rates. Acquisition-driven growth continues to be recognised.
Several adjustments are designed to improve comparability. Banks with less than $10 billion in assets receive no points for scale. Capital adequacy is assessed against each bank’s actual capital position and compliance with applicable regulatory requirements, with zero points where the reported capital adequacy ratio falls below the applicable regulatory minimum. Where quantitative LCR or NSFR requirements have not been implemented or are not in force, the affected weighting is reallocated to the liquid-assets measure. Material one-off items affecting profitability are also normalised where sufficient information is available.
The resulting score is therefore broader than a measure of profitability, capital or asset quality alone. It is designed to assess financial strength across the balance sheet, earnings, risk, liquidity, growth, scale and the sovereign environment in which each institution operates.
Scale is strongly associated with financial strength
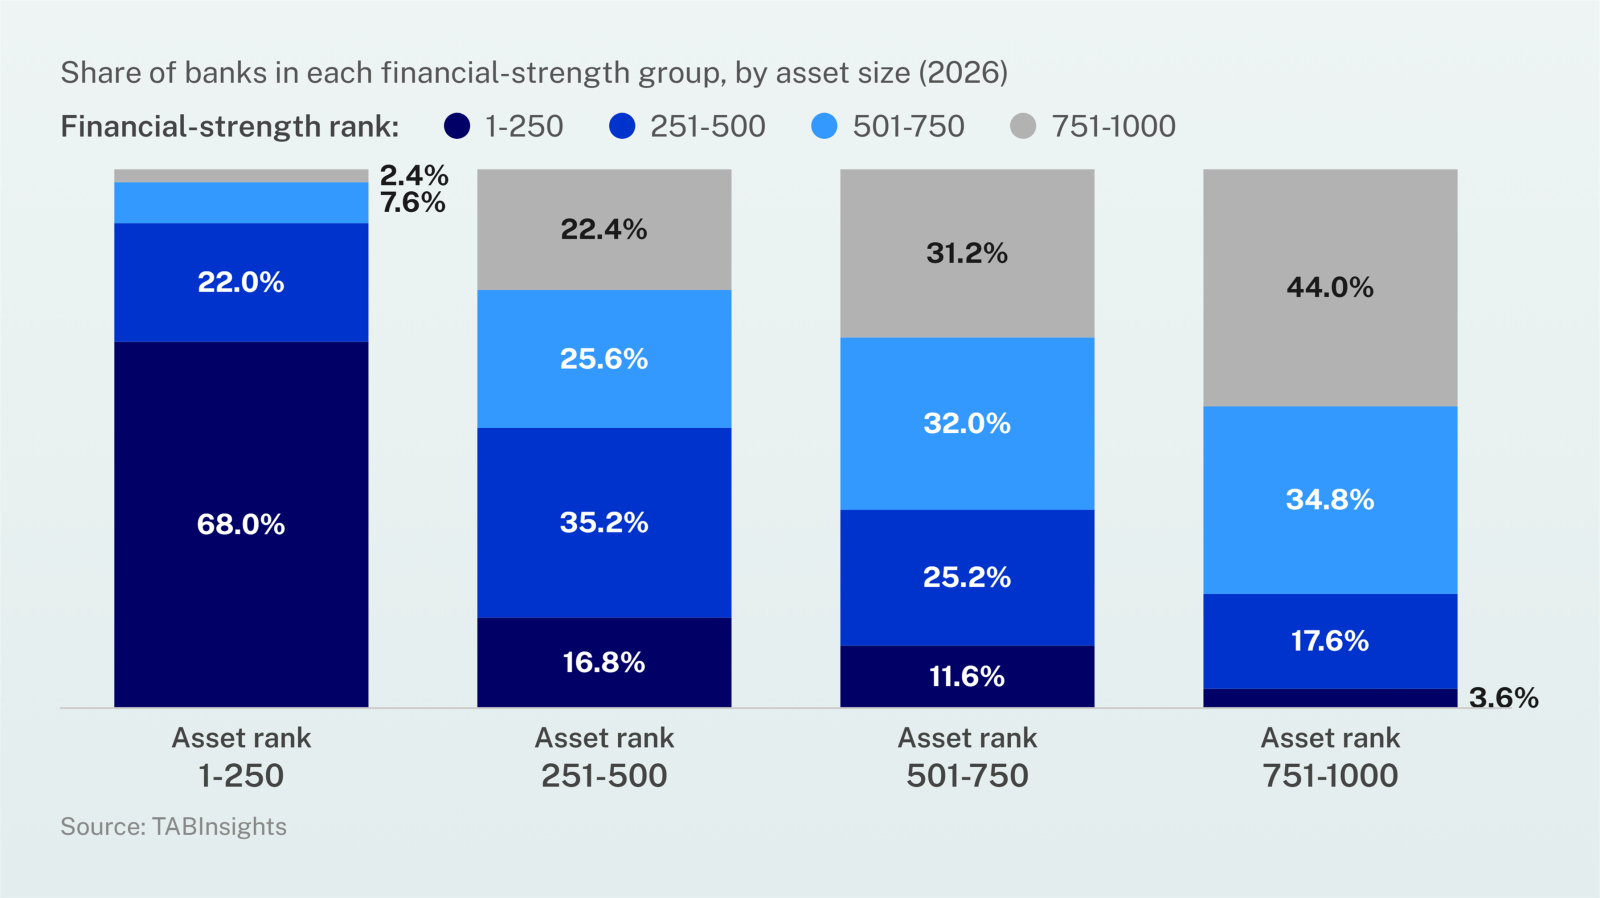
Size and financial-strength rankings are closely related, although part of that relationship is built into the scorecard because assets account for 14.2% of the overall score. Among the 250 largest banks by assets, 68% ranked among the 250 strongest and another 22% ranked between 251st and 500th, while only 2.4% fell into the weakest 250.
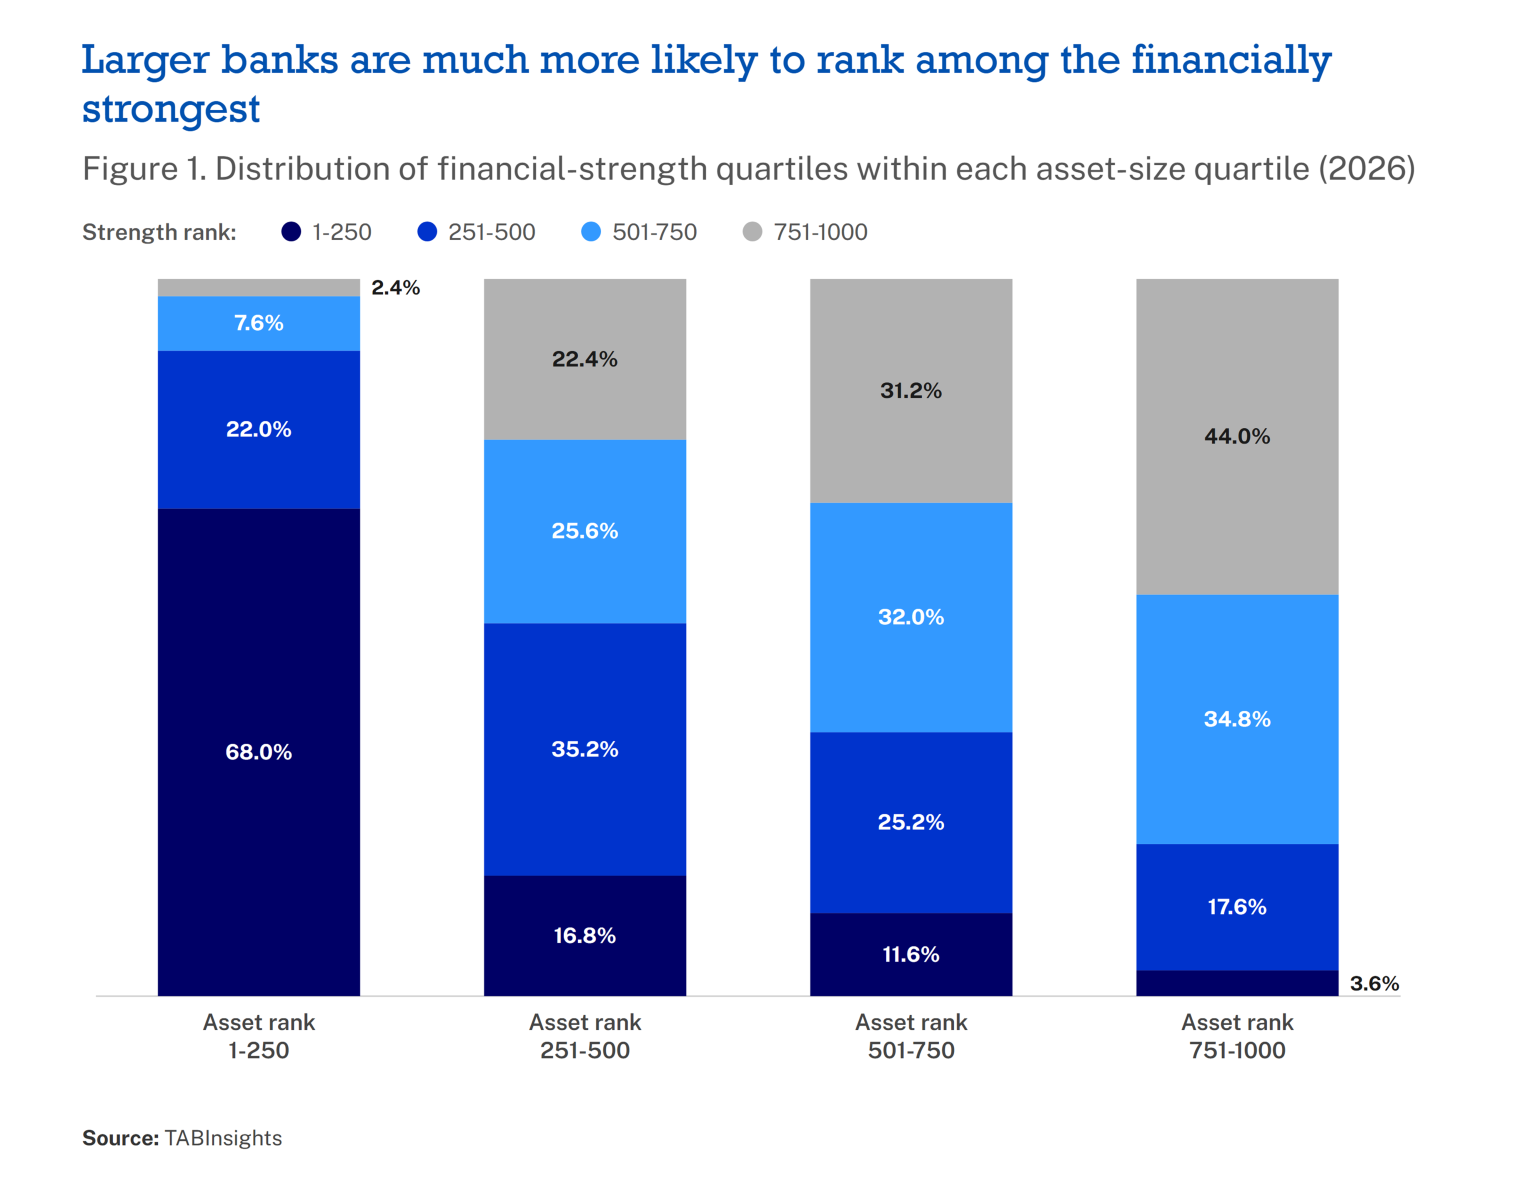
The relationship progressively reverses as bank size declines. Among banks ranked 251st to 500th by assets, 16.8% reached the strongest quartile. The proportion fell to 11.6% among banks ranked 501st to 750th and just 3.6% among the smallest 250. At the other end, 44% of banks ranked 751st to 1,000th by assets were also in the weakest strength quartile.
Scale is nevertheless far from sufficient. Some banks rank hundreds of places above their positions by assets, while some of the world’s larger institutions rank far below them. The exceptions are therefore important in showing the limits of the overall relationship.
An International Monetary Fund Staff Discussion Note identified potential economies of scale from diversification and activities requiring substantial fixed investment, while finding the broader evidence on economies of scale in banking inconclusive. It also highlighted the greater organisational complexity that can accompany bank size.
Larger institutions can have greater capacity to spread technology and other fixed investments across broader businesses and to diversify across activities and markets. The TAB Global results show a strong association between scale and financial strength across the population, while individual institutions can depart substantially from the overall pattern.
The financial profile changes substantially across the ranking
Across the five strength groups used in the analysis, the financial profiles show substantial differences in profitability, efficiency, asset quality, capital and liquidity. The 100 strongest banks generated median ROA of 1.10%, compared with 0.53% among banks ranked 751st to 1,000th. Their median cost-to-income ratio was 39.5%, against 58.5%.
The differences in asset quality were similarly pronounced. Median gross NPLs increased from 1.08% among the strongest 100 to 2.37% among banks ranked 751st to 1,000th, while median loan-loss reserve coverage fell from 156.6% to 51.0%. Median capital adequacy was 18.3% among the strongest 100 compared with 14.5% in the bottom group, while median liquid assets to deposits and borrowings declined from 37.8% to 23.8%.
These measures form part of the strength scorecard, so the differences are primarily useful in showing the financial profile associated with the ranking rather than independently explaining it. More instructive are the measures that do not improve continuously with overall strength. Operating-profit growth, LCR and NSFR, for example, do not follow the same progression. That distinction shows why financial strength cannot be reduced to maximising any one measure.
Fastest profit growth does not correspond with greatest financial strength
Operating-profit growth provides one of the clearest examples. Banks in the lowest quartile recorded median operating-profit growth of -11.7% and a median strength rank of 550. The next quartile, with median profit growth of 1.9%, ranked considerably better at 361.
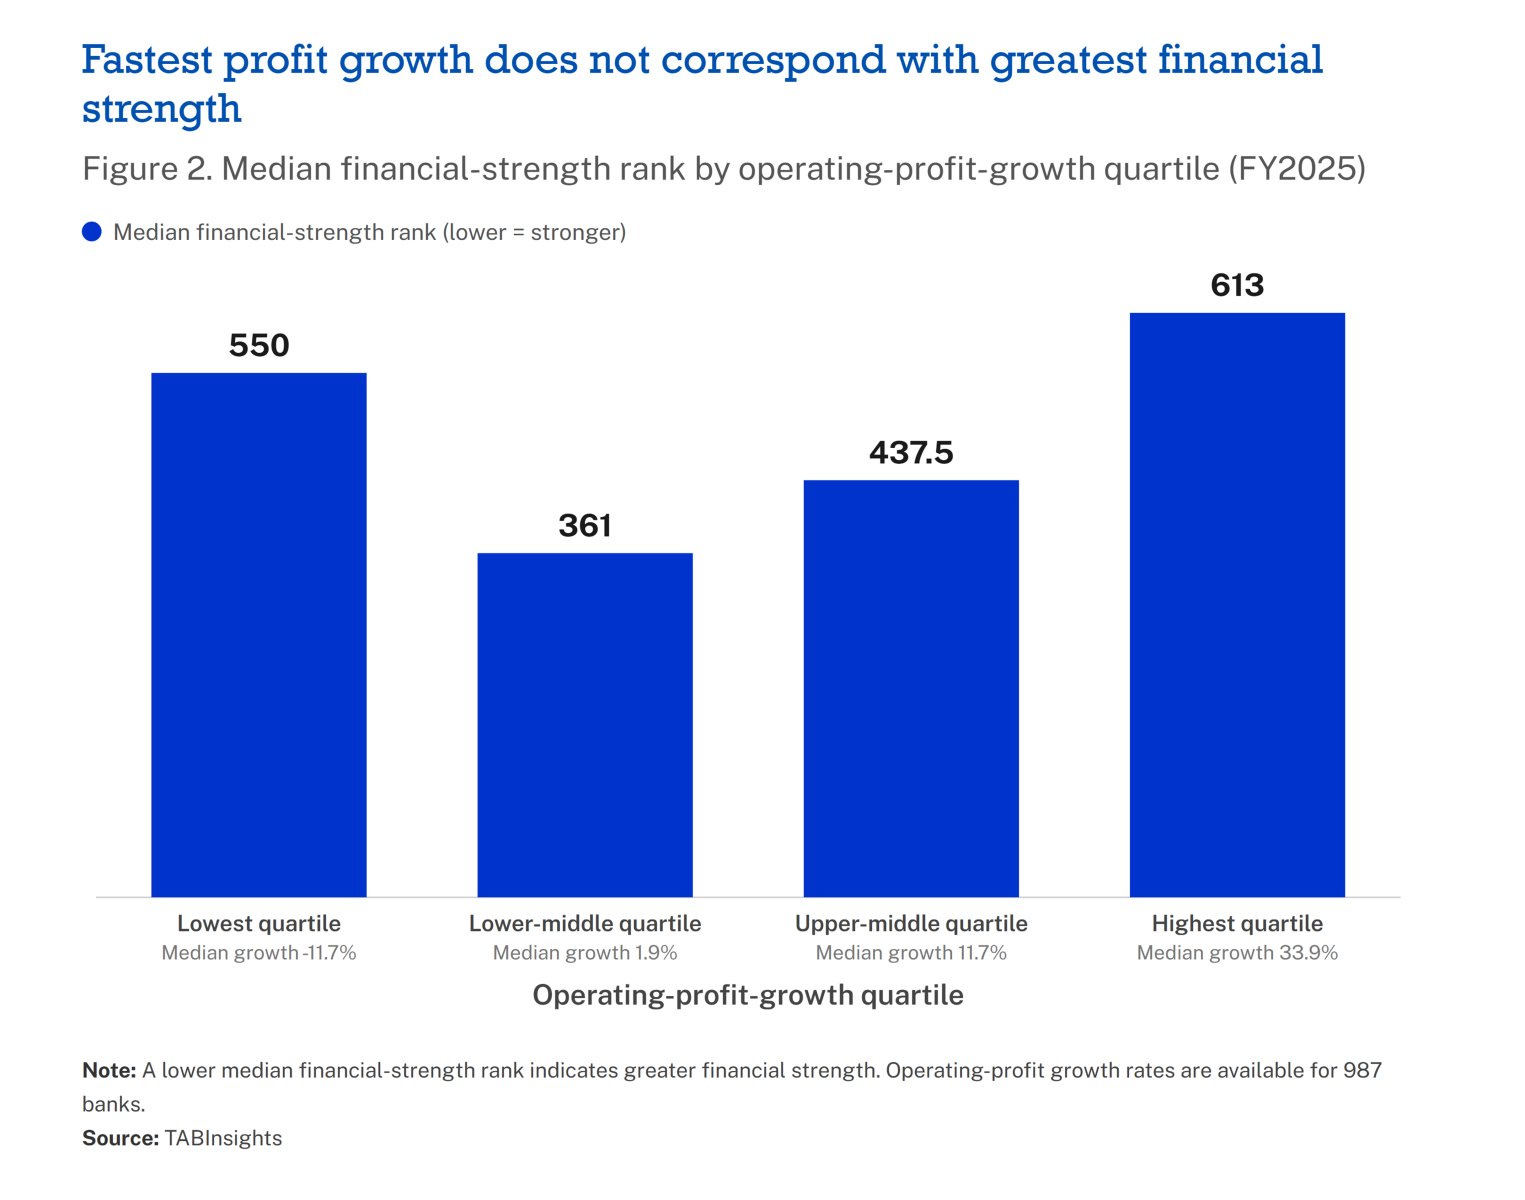
But increasing profit growth further did not produce progressively stronger rankings. Banks in the upper-middle quartile generated median profit growth of 11.7% but had a median strength rank of 437.5, while the fastest-growing quartile recorded median profit growth of 33.9% yet had a median strength rank of 613.
This does not mean rapid profit growth makes a bank weaker. Operating-profit growth accounts for only 2.4% of the overall score, and exceptional one-year earnings expansion can coexist with weaker performance on capital, asset quality, efficiency, liquidity or other measures. It can also reflect institution-specific factors or a low comparative base.
The comparison therefore distinguishes earnings momentum from broader financial strength. Strong profit growth matters, but the fastest-growing banks are not necessarily those with the strongest underlying financial profiles. For banks, the more important question is what is producing the growth and whether capital, asset quality, efficiency, funding and liquidity can support it.
Larger regulatory liquidity buffers do not necessarily mean greater overall strength
Liquidity provides another non-linear relationship. For the broadest liquidity measure in the scorecard, the pattern is relatively clear. Banks in the lowest quartile for liquid assets to deposits and borrowings had a median ratio of 15.3% and a median strength rank of 680.5. The median strength rank improved to 462 for the next quartile, 444 for the upper-middle quartile and 351 for the highest quartile, where the median liquid-assets ratio was 45.9%.
But the regulatory liquidity ratios do not follow the same progression. Among the 651 banks reporting LCRs, the lowest quartile had a median LCR of 129.0% and a median strength rank of 306. The next three groups had median strength ranks of 323, 418.5 and 388 even as their median LCRs increased to 156.7%, 201.0% and 315.2%.
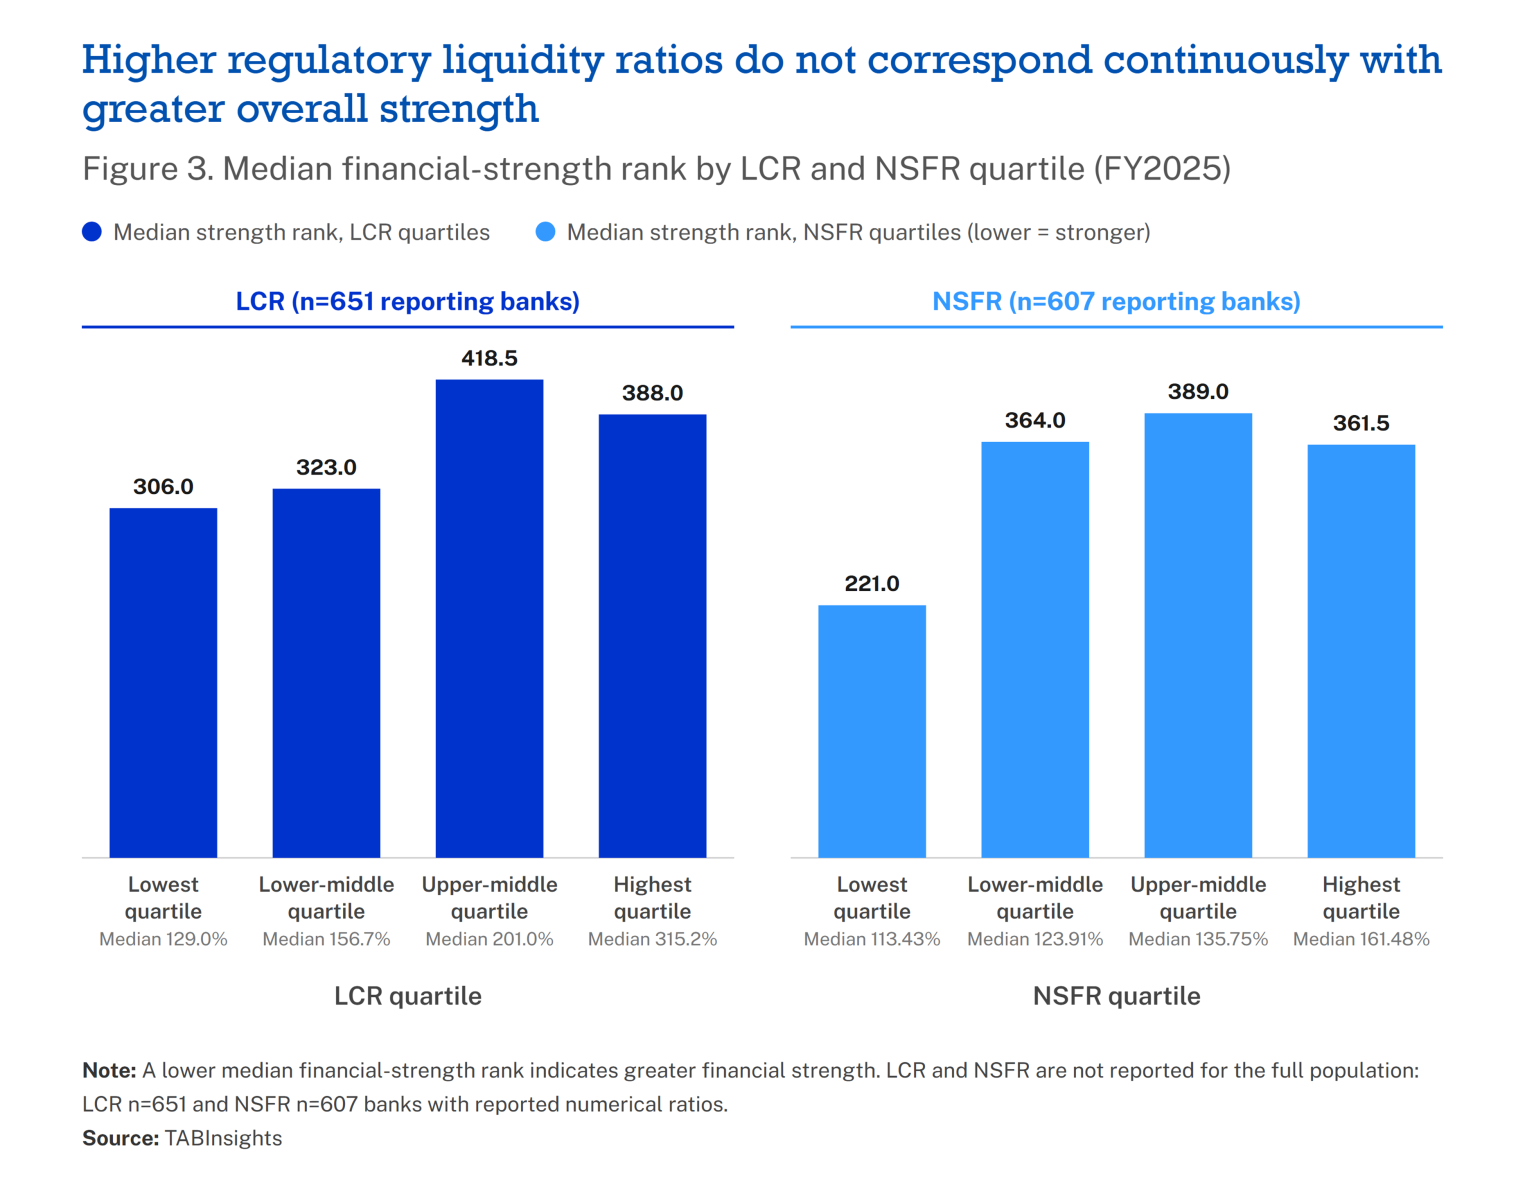
The NSFR was similarly non-linear among the 607 banks reporting the ratio. Banks in the lowest quartile had a median strength rank of 221, compared with 364, 389 and 361.5 across the three progressively higher groups.
These results do not mean lower LCR or NSFR is preferable. Both ratios measure specific aspects of liquidity and funding resilience, and reporting and regulatory applicability differ across markets.
The regulatory purpose of the ratios also matters. The Basel liquidity framework designed the LCR to strengthen short-term liquidity resilience by requiring sufficient high-quality liquid assets to withstand a 30-day stress period, while the NSFR addresses the sustainability of banks’ funding structures over a longer horizon. They therefore address particular dimensions of liquidity and funding risk rather than providing comprehensive measures of financial strength.
The TAB Global results should be read in that context. Progressively larger regulatory liquidity ratios do not translate mechanically into greater overall financial strength. Liquidity has to be considered alongside what the bank earns, the risks it carries and how efficiently it deploys its balance sheet.
Smaller banks can overcome the scale disadvantage
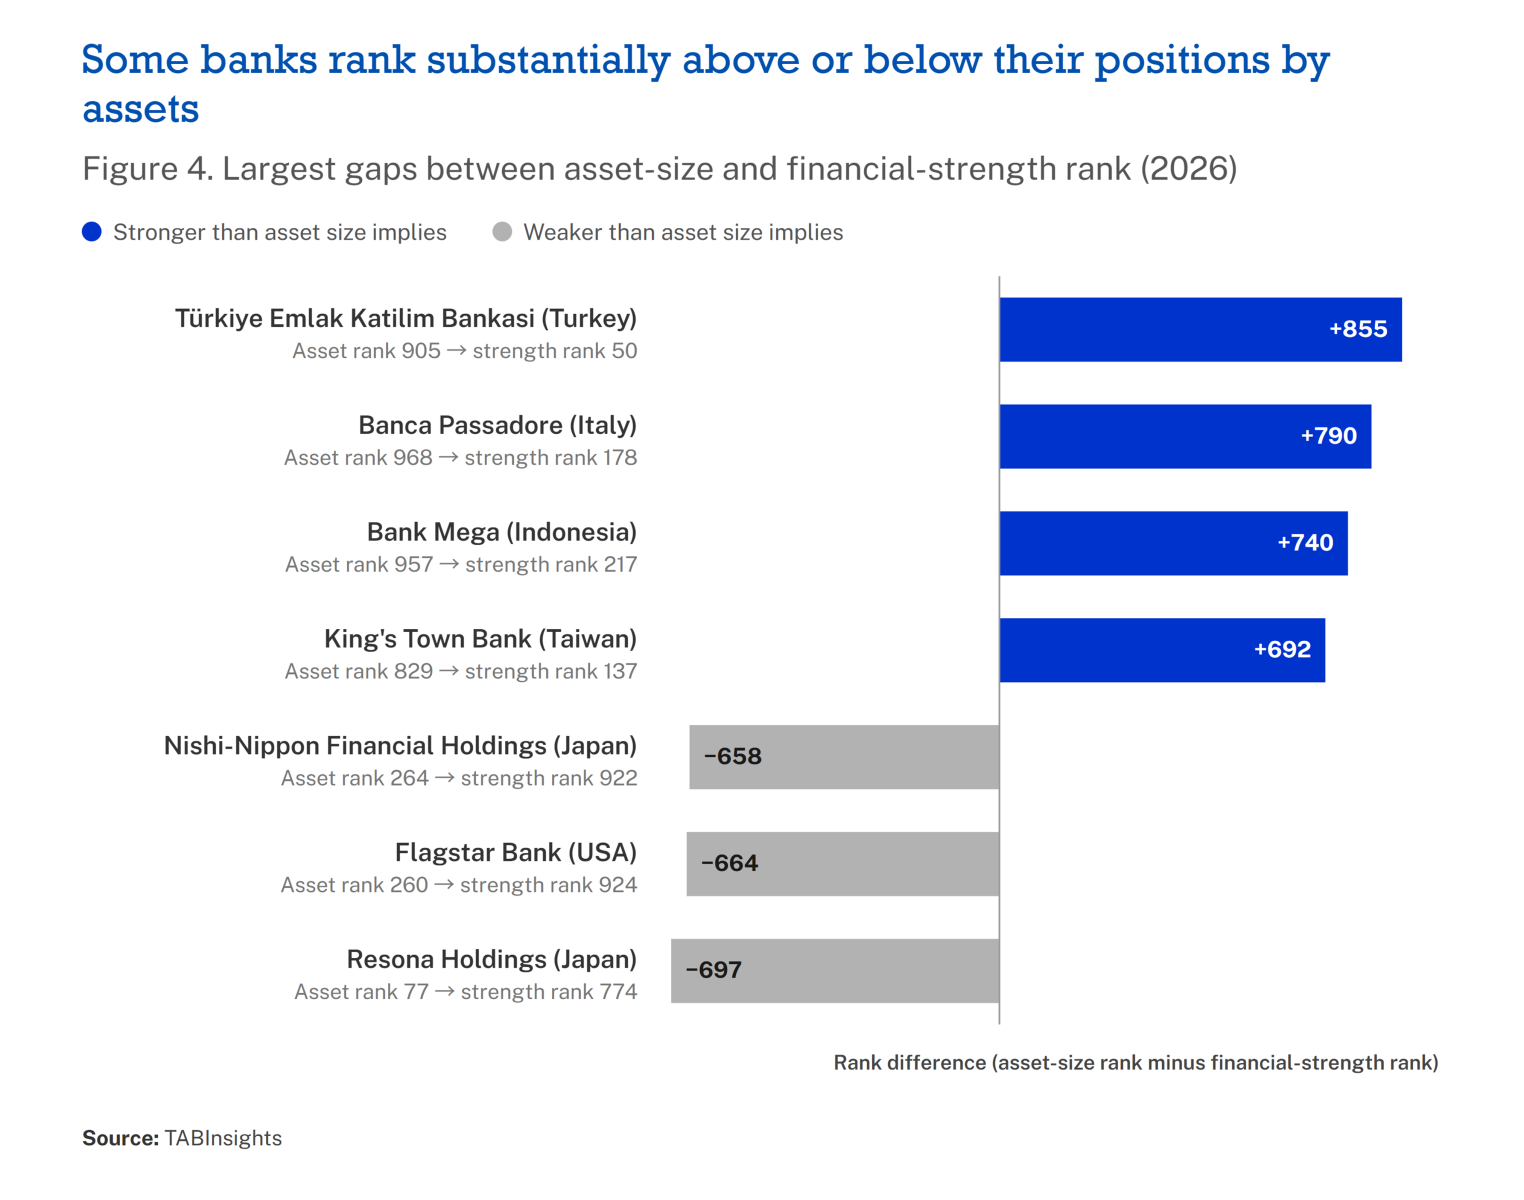
Some of the most instructive institutions are those that break the relationship between size and strength. Turkiye Emlak Katilim Bankasi provides the most striking example. It ranked 905th by assets but 50th in financial strength, a difference of 854 positions.
Its balance sheet was $9.7 billion, below the $10 billion threshold at which banks begin receiving points for scale. Yet it generated ROA of 5.1%, maintained a cost-to-income ratio of 35.0%, a gross NPL ratio of 1.63%, loan-loss reserve coverage of 132.0% and a capital adequacy ratio of 20.9%. Its inflation-adjusted loan growth was 57.2%.
Other relatively small institutions show the same broad pattern. Banca Passadore ranked 968th by assets but 178th strongest, a difference of 790 positions. Indonesia’s Bank Mega was 957th by assets but 217th for strength, while Taiwan’s King’s Town Bank ranked 829th by assets and 137th for strength. Their rankings show how stronger results across other scorecard measures can substantially offset the disadvantage associated with limited scale.
The reverse is equally instructive. Resona Holdings was the 77th-largest institution but ranked 774th in financial strength, a difference of 697 positions. Flagstar Bank ranked 260th by assets but 924th by strength, while Nishi-Nippon Financial Holdings ranked 264th by assets and 922nd by strength.
Their financial profiles help show why size alone is insufficient. Resona generated ROA of 0.34% and had a capital adequacy ratio of 12.5% and reserve coverage of 30.9%. Flagstar recorded negative ROA of 0.19%, a cost-to-income ratio of 93.8%, gross NPLs of 4.88% and reserve coverage of 34.6%.
The overall population shows the strong relationship between size and strength, while the exceptions show the extent to which performance across profitability, efficiency, capital, asset quality, liquidity and growth can offset the disadvantage associated with limited scale. For smaller institutions, stronger performance across the other scorecard measures can offset much of that disadvantage. For larger institutions, balance-sheet size alone is insufficient to produce a high strength ranking.
Regional differences extend beyond sovereign risk
Financial strength is unevenly distributed geographically. The Middle East had the highest representation in the strongest quartile: 29 of its 65 ranked banks, or 44.6%, were among the global top 250. Europe followed at 34.0%, Asia Pacific at 25.9% and North America at 14.8%, while Latin America and the Caribbean and Africa had only 6.9% and 6.3%, respectively, of their ranked institutions in the strongest quartile.
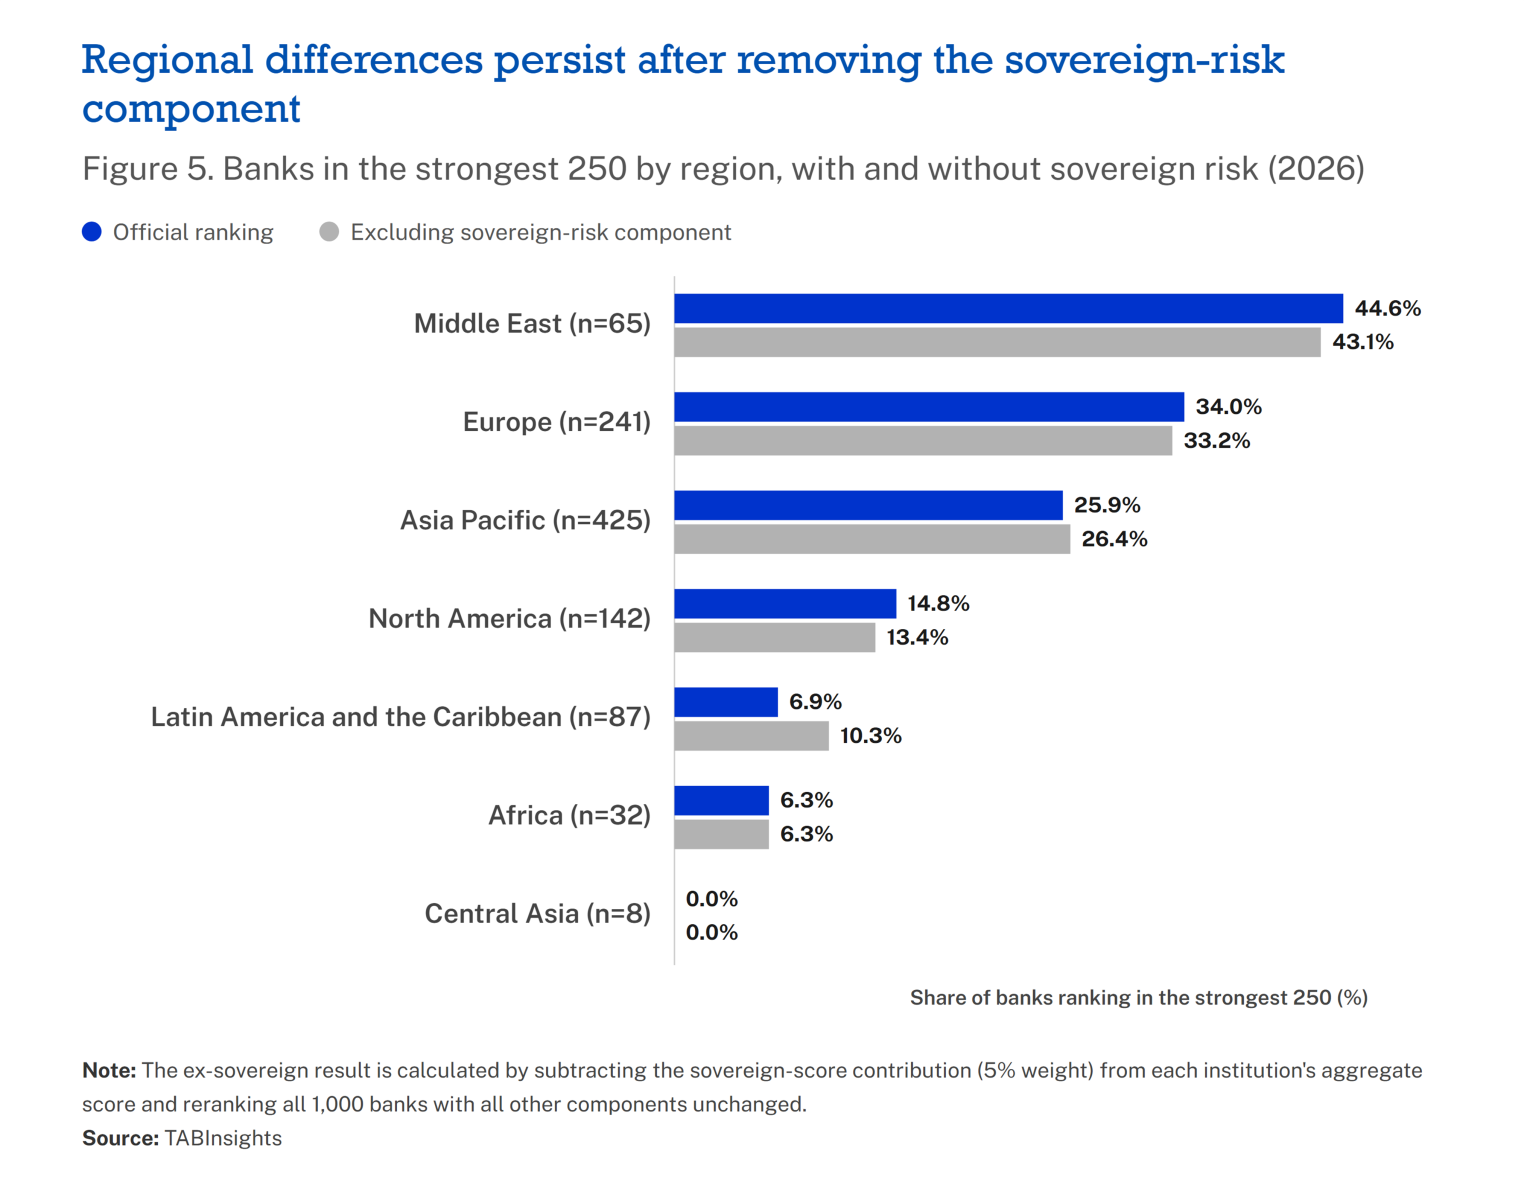
The introduction of sovereign risk as 5% of the 2026 score means part of those differences could reflect the operating environment rather than bank-level financial performance alone. To test how much the new sovereign-risk component affects the regional pattern, the sovereign contribution was removed from each bank’s aggregate score and the 1,000 banks were reranked, with all other score components unchanged.
The broad regional pattern changes relatively little. The Middle East’s representation among the strongest 250 falls from 44.6% to 43.1%. Europe moves from 34.0% to 33.2%, while Asia Pacific edges up from 25.9% to 26.4%. The effect is more visible in Latin America and the Caribbean, where the proportion rises from 6.9% to 10.3%. Africa remains at 6.3%, while North America eases from 14.8% to 13.4%.
Conditions among Gulf banks provide additional context for the Middle East’s position. S&P Global Ratings expected Gulf Cooperation Council (GCC) banks to remain financially resilient despite regional instability, supported by robust capital buffers. The average Tier 1 capital ratio of the region’s 50 largest banks was about 17% at the end of March 2026. S&P also found that larger domestic economies and faster growth had supported bank profitability in Saudi Arabia and the United Arab Emirates, contributing to better operating efficiency within the region. It nevertheless expected GCC bank profitability to decline slightly in 2026 and 2027 as slower credit expansion and higher cost of risk offset some of those advantages.
These conditions do not explain the ranking positions of individual Middle Eastern banks or establish why the region performs better than others in the TAB Global assessment. They do, however, provide independent context for some of the underlying financial characteristics of a significant group of institutions represented in the regional results.
The TAB Global comparison itself shows that sovereign ratings influence the relative positions of individual banks and some regions, but do not explain the broader geographic distribution of financial strength. The Middle East remains the region with the highest proportion of banks in the strongest quartile even after the sovereign component is removed.
Financial strength comes from balance rather than maximisation
The TAB Global 1000 World’s Strongest Banks 2026 ranking shows that scale matters substantially. Larger institutions are far more heavily represented among the strongest banks, although part of that relationship is embedded in the scorecard because assets contribute 14.2% of the overall score. The exceptions are nevertheless significant: some smaller institutions rank hundreds of places above their positions by assets, while some much larger institutions rank far below them.
Nor does maximising an individual financial measure necessarily produce greater overall strength. The banks with the fastest operating-profit growth are not the strongest group overall, while progressively larger regulatory liquidity ratios do not correspond with progressively stronger rankings.
The regional comparison provides another dimension. Middle Eastern banks remain disproportionately represented among the strongest institutions even when the sovereign-risk contribution is removed, while external evidence on Gulf banks’ capital, profitability and efficiency provides context for part of the region’s performance.
For banks, the more useful benchmark is therefore not simply where they rank, but where their financial model is unbalanced. Earnings growth is more meaningful when it is supported by sustainable profitability and strength elsewhere in the financial model. Liquidity and capital provide resilience, but holding progressively larger buffers is not a substitute for deploying the balance sheet effectively. The results also show that scale alone is insufficient: institutions still need to combine it with sustainable earnings, efficiency and risk resilience.
Financial strength ultimately comes from the interaction of these characteristics rather than the maximisation of any one of them. The strongest banks are those able to use their balance sheets to generate sustainable earnings while maintaining the capital, asset quality, funding and liquidity needed to absorb periods when conditions become less favourable.
BANK WATCH LIST
Bangladesh continues to face elevated asset quality challenges
Balance sheets and financial results-based evaluations are, by nature and definition, backward-looking. To overcome this, we introduced a forward-looking element called the “Bank Watch List” into the strongest bank evaluation.
What is the Bank Watch List?
It identifies and considers the impact of specific evaluation parameters on balance sheet strength, should macroeconomic and business conditions change.
By identifying the parameters and institutions that are most likely to be impacted by such changes, we aim to provide a holistic 360-degree view of the ranking without materially changing the composition of the scorecard. The identification and setting of the parameters are based on analysis by TABInsights, the research arm of The Asian Banker, of past performance as well as outlook of the banking sector in the region.
Who is on the Bank Watch List?
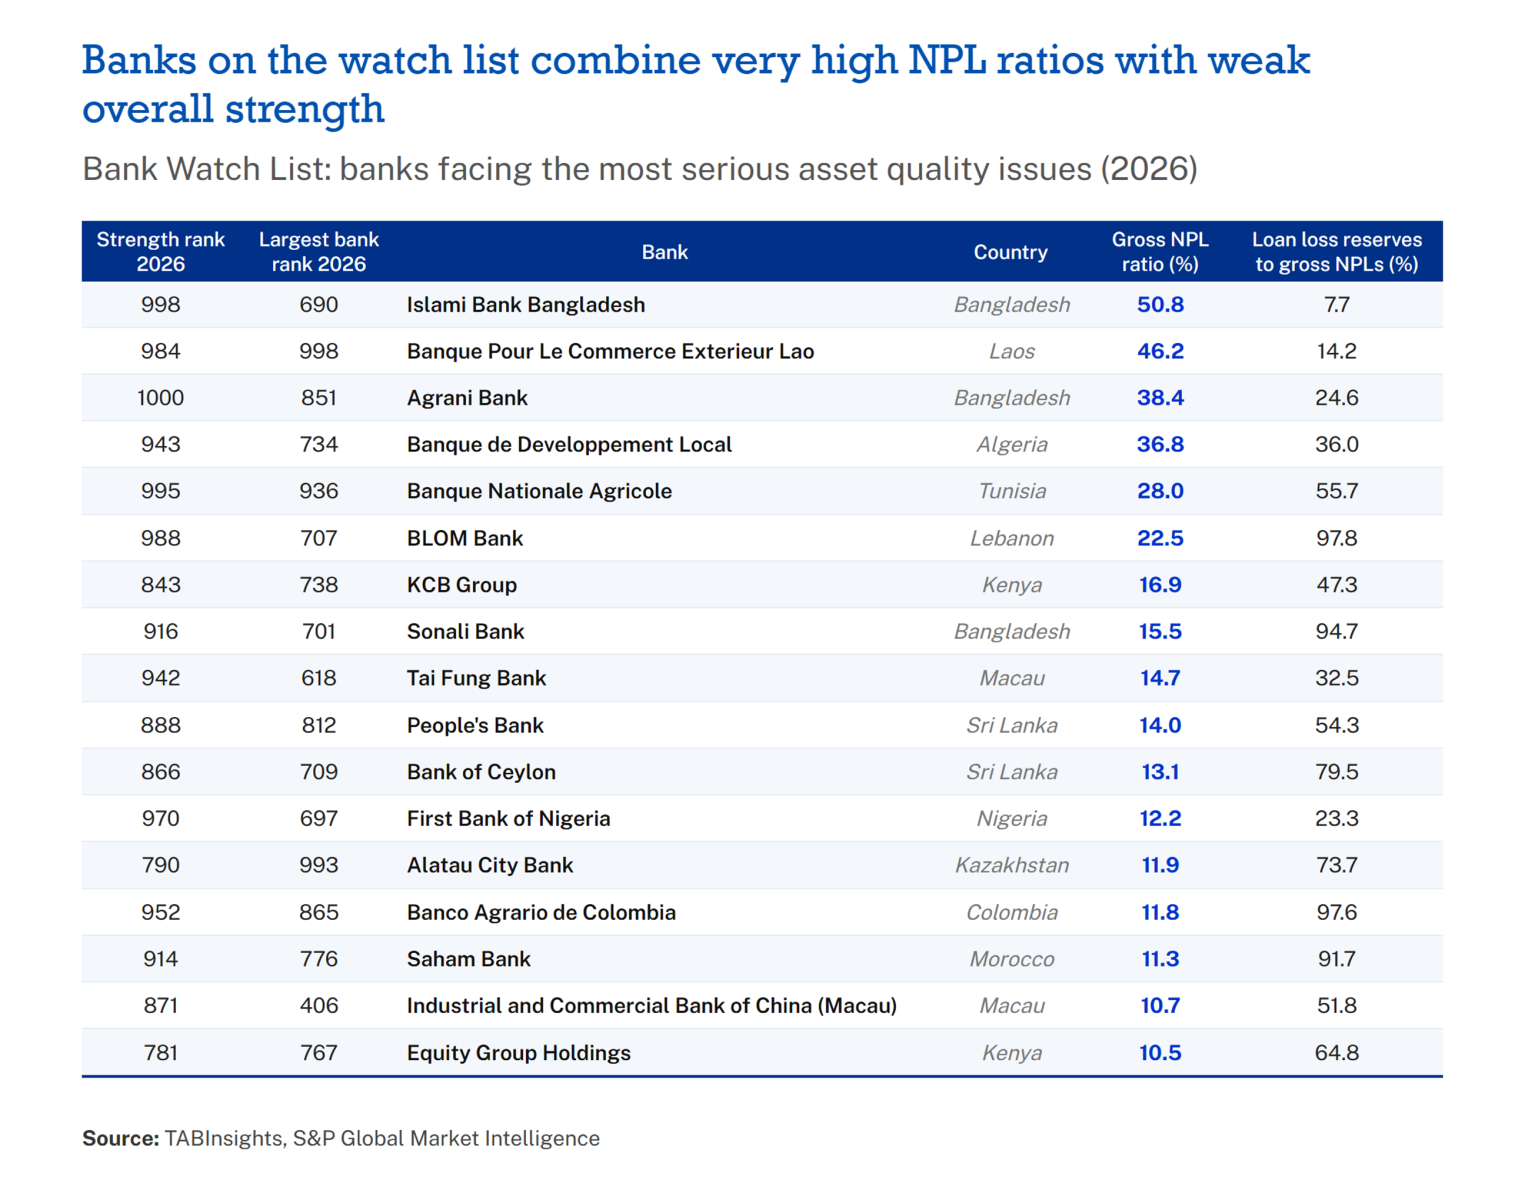
The 2026 list includes 17 banks across 12 markets. Together, these banks report an aggregate gross non-performing loan (NPL) ratio of 21.1%, compared with a median of 1.6% among the 986 ranked banks that disclose the metric. Their loan loss reserves cover 39.7% of NPLs, compared with a median coverage ratio of 107.5% across all ranked banks, leaving significant provisioning gaps.
These asset quality pressures are reflected in overall strength rankings, with 11 of the 17 banks ranking among the bottom 100 in the TAB Global 1000 World’s Strongest Banks 2026 ranking.
Bangladesh accounts for three of the banks on the list, following changes to loan classification rules that shortened the overdue period for classifying a loan from six months to three months, which increased the recognition of stressed assets across the banking sector. Islami Bank Bangladesh reported the highest gross NPL ratio at 50.8% in FY2025, up from 42.5% a year earlier. The increase followed the recognition of previously concealed loans linked to the S. Alam Group, while reserve coverage stood at 7.7%. Agrani Bank reported an NPL ratio of 38.4%, with coverage of 24.6%, while Sonali Bank recorded an NPL ratio of 15.5% and improved its coverage ratio to 94.7%.
The trend among returning banks was more positive. Of the 12 banks that remained from last year’s list, 11 reduced their NPL ratios and 10 increased reserve coverage, while seven others were excluded because FY2025 data was unavailable by the ranking cutoff.
In Sri Lanka, People’s Bank Sri Lanka reduced its NPL ratio from 17.6% to 14.0%, while Bank of Ceylon declined from 15.2% to 13.1%. In Lebanon, BLOM Bank reduced its NPL ratio from 25.2% to 22.5%, although its coverage ratio of 97.8% remained below the 100% threshold.
What does it mean to be on the Bank Watch List?
In this year’s ranking, we have identified gross NPL ratio (above 10%) and loan loss reserves to gross NPLs ratio (below 100%) as parameters that will impact financial strength due to fluctuations in macroeconomic and business conditions. The Bank Watch List is a tool to monitor and review parameters to give a holistic view of financial strength and the institutions being evaluated. This is the first iteration of what we think will be a powerful tool for the industry globally to benchmark and review financial strength; the list will be continuously enhanced.
View the full ranking for the TAB Global 1000 World’s Strongest Banks.











 Google
 LinkedIn